
Mastering Candlestick Patterns: A Comprehensive Guide to Effective Forex Trading
Candlestick patterns are a fundamental aspect of forex trading, providing traders with valuable insights into market sentiment and price movements. By understanding and interpreting these patterns, traders can make informed decisions that enhance their trading strategies. In this guide, we’ll delve into the world of candlestick trading and explore how these patterns can be effectively utilized in the forex market.
What is a Candlestick?
A candlestick is a graphical representation of price movements in financial markets, including the forex market. It’s a way to visually depict the open, high, low, and close prices of a trading instrument, such as a currency pair, stock, commodity, or index, over a specific period of time.
The structure of a candlestick consists of four main components:
Opening Price: The price at which a trading instrument begins trading during the time period being represented by the candlestick.
Closing Price: The price at which a trading instrument ends trading during the same time period. This is represented by the end of the candlestick’s body.
High Price: The highest price reached by the trading instrument during the time period. This is represented by the upper end of the vertical line extending above the body of the candlestick.
Low Price: The lowest price reached by the trading instrument during the time period. This is represented by the lower end of the vertical line extending below the body of the candlestick.
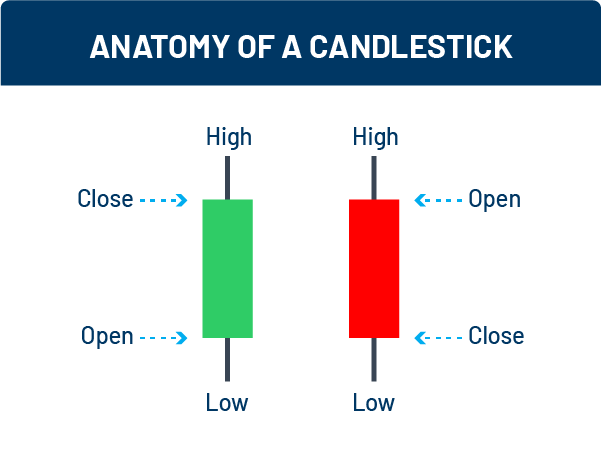
The body of the candlestick is the rectangular area between the opening and closing prices. It’s often filled or colored differently to indicate whether the closing price is higher (bullish) or lower (bearish) than the opening price. If the closing price is higher than the opening price, the body is usually colored green or white, indicating bullishness. If the closing price is lower than the opening price, the body is usually colored red or black, indicating bearishness.
The lines extending above and below the body are called wicks or shadows. The upper wick represents the high price, and the lower wick represents the low price. These wicks provide additional information about the price range and the extent of price movements during the given time period.
Candlestick patterns are formed by the combination of these components across multiple candlesticks. Traders analyze these patterns to gain insights into market sentiment and potential price trends. Different patterns can suggest reversals, continuations, or indecision in the market.
Candlestick charts are widely used in technical analysis to help traders make informed decisions about when to enter or exit trades. By understanding the patterns and the story they tell, traders aim to predict future price movements and improve their trading strategies.
Foundation of Candlestick Patterns
Candlestick charts are the bedrock of technical analysis in forex trading. Each candlestick consists of four main components: the opening price, closing price, upper wick (shadow), and lower wick (shadow). The body of the candlestick represents the price range between the opening and closing prices. Bullish candlesticks have a higher closing price than opening price, while bearish candlesticks have a lower closing price.
Key Candlestick Patterns:
- Doji
- Hammer
- Shooting Star
- Engulfing Pattern
- Harami Pattern
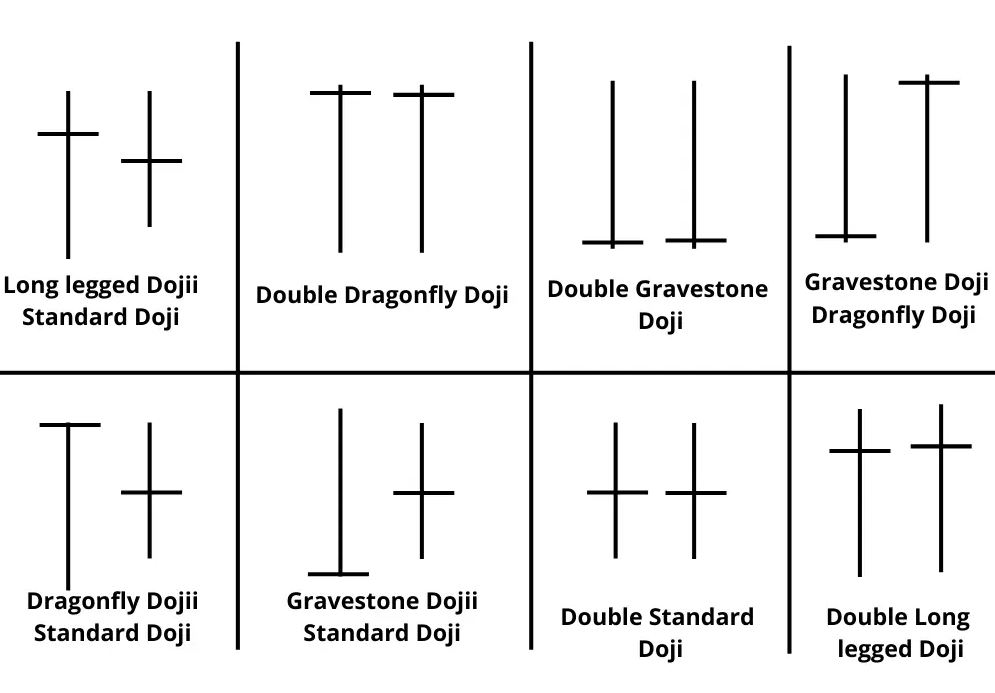
Doji: A single candlestick with a small body, indicating indecision in the market.

Hammer: A bullish reversal pattern with a small body and a long lower wick, suggesting potential upward movement.
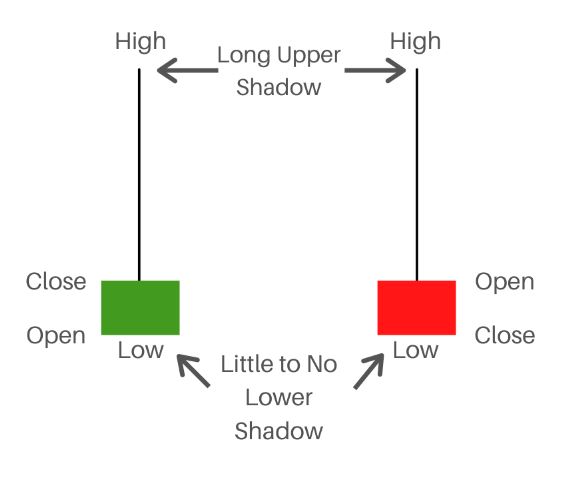
Shooting Star: A bearish reversal pattern characterized by a small body and a long upper wick, signalling possible downward movement.
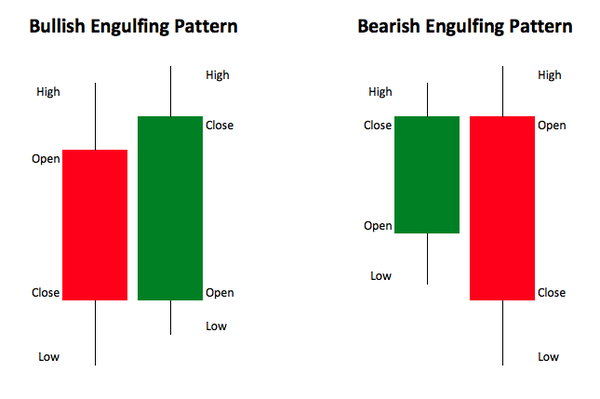
Engulfing Pattern: A two-candle pattern where the second candle completely engulfs the first, indicating a potential reversal.
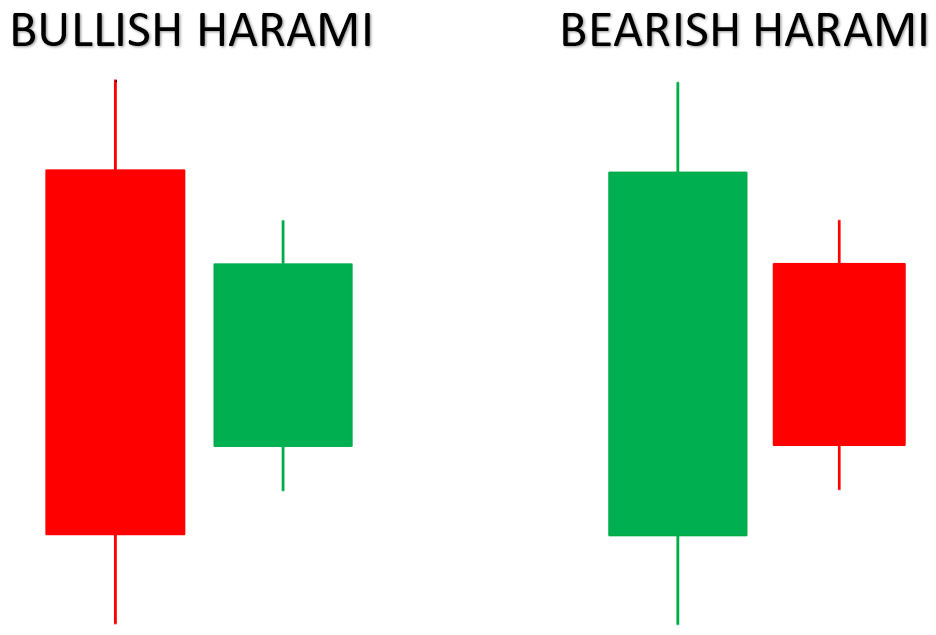
Harami Pattern: A two-candle pattern where the second candle is contained within the body of the first, suggesting a possible trend reversal.
Identifying Candlestick Patterns
Successfully identifying candlestick patterns requires selecting appropriate timeframes and practicing keen observation. Higher timeframes provide more reliable signals, while lower timeframes may produce false positives. Confirmation through increased trading volume can validate the significance of a candlestick pattern, enhancing the likelihood of accurate predictions.
In order to trade a candlestick successfully, you need MT4 or MT5 platform. We recommend using FXGT.com’s MT4 platform for you to learn this forex trading strategy. You may login here or, alternatively, you can register here and download the platform.
Incorporating Candlestick Patterns into Forex Trading
To effectively integrate candlestick patterns into trading strategies, it’s crucial to combine them with other technical indicators. This synergy helps create more robust signals. For example, using candlestick patterns in conjunction with moving averages or support and resistance levels can enhance the accuracy of trade entries and exits. Always remember to practice proper risk management to protect your capital.
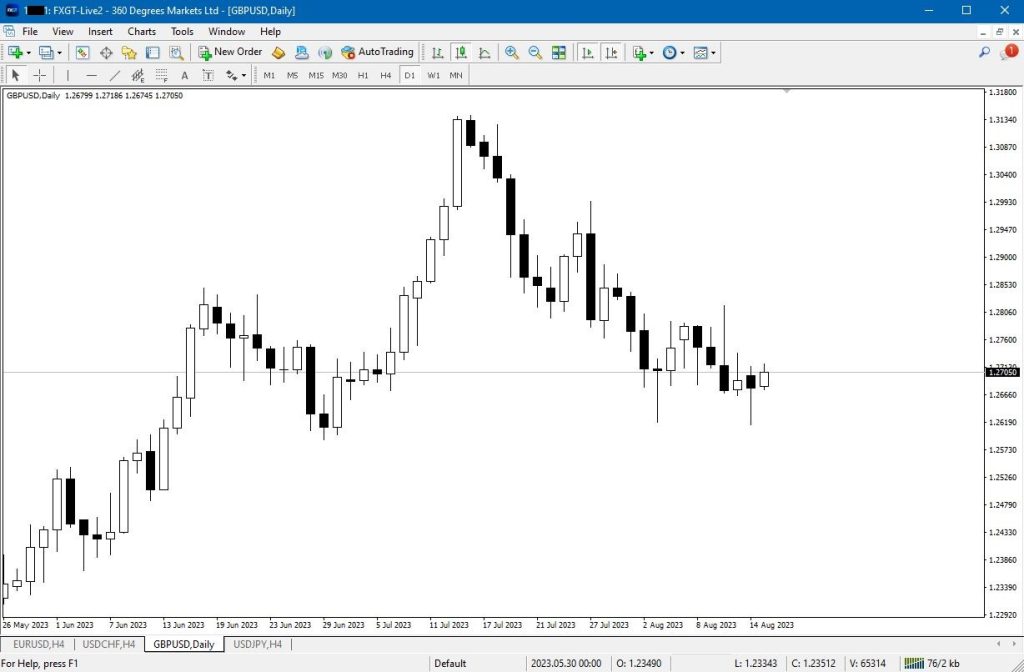
Best timeframes to identify candlestick patterns:
- Weekly timeframe
- Daily timeframe
- 4 Hourly timeframe
From these timeframes, you can combine the forex trading strategy such as support and resistance, Fibonacci or moving averages.
Advanced Candlestick Strategies
In addition to basic patterns, more complex formations like the Three Black Crows, Evening Star, Three White Soldiers, and Morning Star offer advanced insights. By mastering these intricate patterns, traders can gain a deeper understanding of market dynamics. Combining multiple patterns can generate more nuanced trading signals, providing a holistic view of market trends.
Let’s dive deeper into these advanced candlestick patterns and how traders can utilize them to enhance their forex trading strategies:
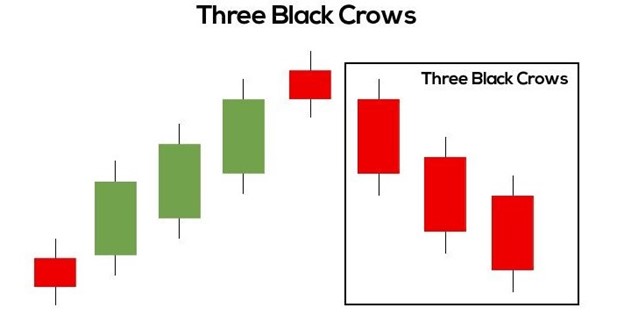
1. Three Black Crows: The Three Black Crows is a bearish reversal pattern that consists of three consecutive long bearish candlesticks. Each candle opens within the body of the previous candle and closes near its low. This pattern suggests a strong shift in sentiment from bullish to bearish and can signal the potential for a downward trend reversal.
Traders often look for confirmation of this pattern through other technical indicators or fundamental factors. The pattern becomes more reliable when it appears after an uptrend, indicating a potential change in market direction.
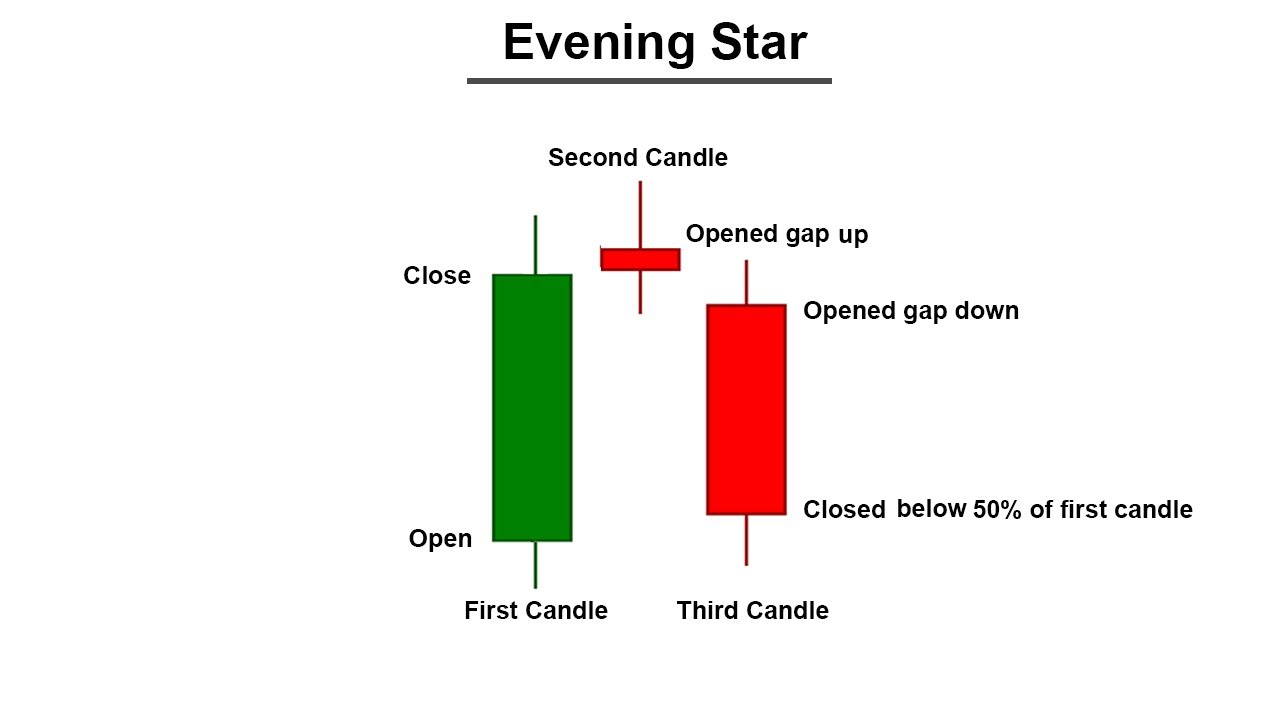
2. Evening Star: The Evening Star is a bearish reversal pattern that typically appears after a bullish trend. It consists of three candlesticks:
- A large bullish candle.
- A small-bodied candle that can be bullish or bearish, which signifies indecision.
- A larger bearish candle that closes below the midpoint of the first candle’s body.
The Evening Star suggests that the bullish momentum is weakening, and a potential reversal to a downtrend might be in play. Traders often use this pattern in conjunction with other technical tools, such as trendlines or moving averages, to confirm the reversal.
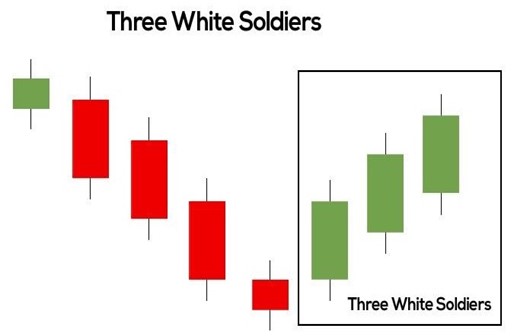
3. Three White Soldiers: The Three White Soldiers is the bullish counterpart of the Three Black Crows. It’s a bullish reversal pattern made up of three consecutive long bullish candlesticks. Each candle opens within the body of the previous candle and closes near its high. This pattern signals a shift from bearish to bullish sentiment and implies the potential for an upward trend reversal.
Like other candlestick patterns, traders use the Three White Soldiers in conjunction with other indicators to increase the reliability of their trading decisions. It’s often seen as a strong bullish signal when it appears after a downtrend.
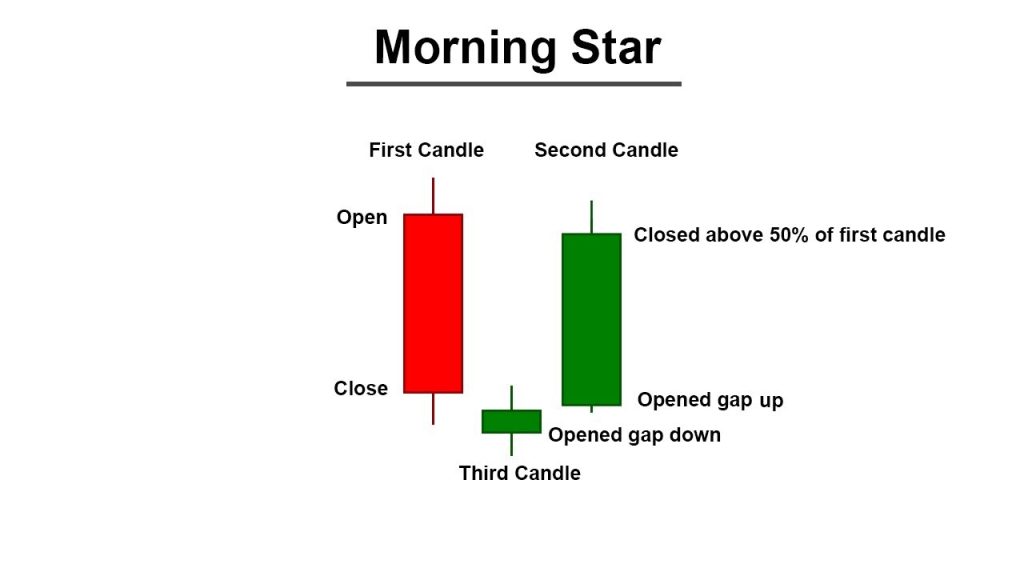
4. Morning Star: The Morning Star is the bullish version of the Evening Star and indicates a potential trend reversal from bearish to bullish. It consists of three candlesticks:
- A large bearish candle.
- A small-bodied candle that can be bullish or bearish, signifying indecision.
- A larger bullish candle that closes above the midpoint of the first candle’s body.
This pattern suggests a weakening bearish momentum and the potential for a bullish turnaround. Traders may use the Morning Star in combination with other tools to confirm the reversal and make more informed trading decisions.
Combining Multiple Patterns
Advanced traders often go beyond individual candlestick patterns and combine multiple patterns to create more nuanced trading signals. By analyzing the interplay between different patterns and their occurrences in specific market contexts, traders can gain a holistic view of market trends and potential price movements.
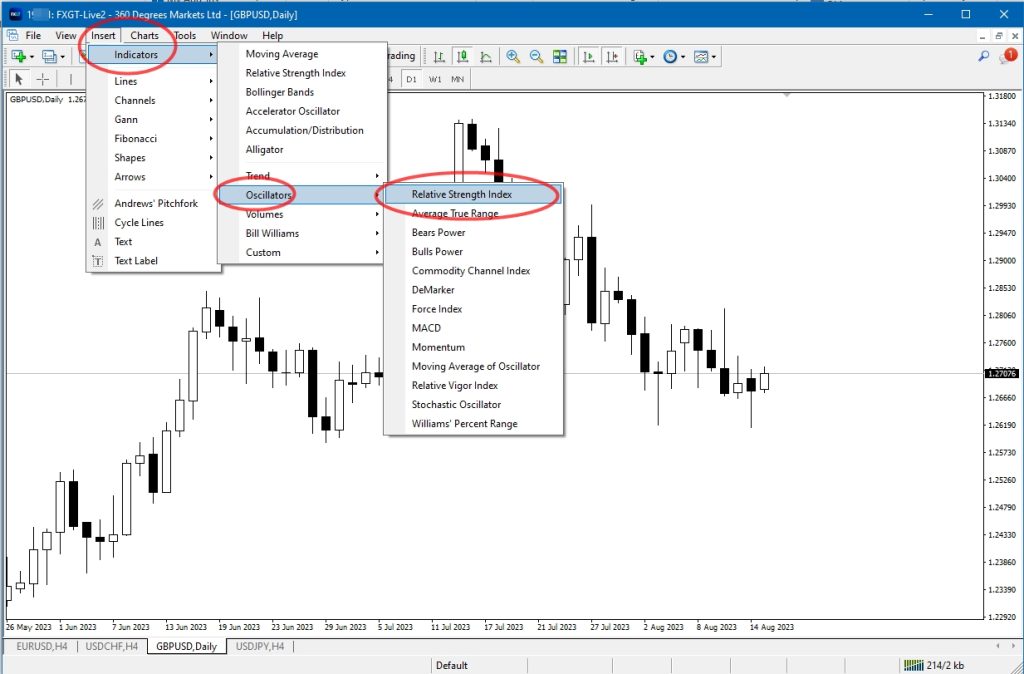
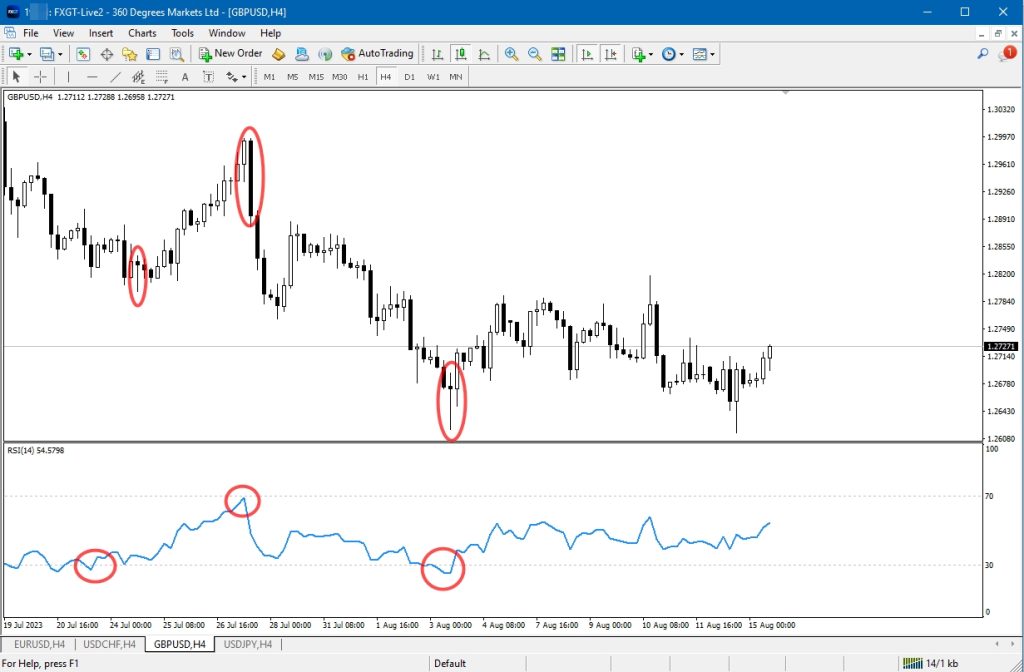
For instance, a trader might look for the convergence of the Evening Star pattern with a bearish divergence in an oscillator like the Relative Strength Index (RSI). This confluence of signals can provide a stronger indication of a potential downward reversal. These indicators are available on the FXGT.com MT4/MT5 trading platforms.
It’s important to remember that while candlestick patterns offer valuable insights, they should not be used in isolation. Traders should always consider other technical indicators, fundamental factors, and risk management strategies to make well-rounded trading decisions.
Incorporating advanced candlestick patterns into your trading arsenal requires practice, observation, and continuous learning. As you become more proficient, you’ll be better equipped to identify subtle nuances in price movements and develop more effective trading strategies.
Common Mistakes to Avoid
Novice traders often make mistakes when solely relying on candlestick patterns. It’s essential to avoid overtrading based on isolated patterns and instead seek confirmation from other technical or fundamental factors. Blindly following candlestick signals without considering the bigger picture can lead to costly errors.
Never ever trade the candlestick pattern over-confidently or without proper risk management.
Backtesting and Practicing with Candlestick Patterns
Backtesting involves evaluating the performance of candlestick-based trading strategies using historical data. This process helps identify the effectiveness of different patterns under various market conditions. Additionally, practicing with demo accounts allows traders to apply candlestick analysis in a risk-free environment, refining their skills before trading with real funds.
You can use the FXGT.com MT4 or MT5 platform for the backtest. You can scroll back the past history to make your own research and study to learn about the candlestick pattern.
Conclusion
Mastering candlestick patterns is a journey that requires dedication, continuous learning, and practical application. By comprehending the foundation of candlestick charts, recognizing key patterns, integrating them into strategies, and avoiding common pitfalls, traders can harness the power of candlestick analysis to navigate the complex world of forex trading. Remember, consistency and discipline are key traits for successful traders, and candlestick patterns are a valuable tool in your trading arsenal.
For traders who seeking a reliable and user-friendly platform to apply these strategies, FXGT.com’s MT4 platform is an excellent choice. With its intuitive interface and comprehensive technical analysis tools, MT4 and MT5 empowers traders to spot and act upon candlestick patterns effectively. By registering with FXGT.com and using the MT4 platform, you can elevate your forex trading experience and make more informed trading decisions.
Remember that while candlestick patterns provide valuable insights, it’s crucial to complement them with other technical indicators, fundamental analysis, and disciplined risk management practices. Your journey towards becoming a successful forex trader is marked by continuous learning, practice, and the thoughtful integration of diverse strategies.
For more information about the current FXGT.com promotions please visit here.
-ADMIN-
Credit photo: FXGT MT4, google images search


