MACD SETTINGS: HOW TO NAVIGATE TRENDS AND DIVERGENCES LIKE A PRO
The MACD (Moving Average Convergence Divergence) is a trend-following momentum indicator that shows the relationship between two moving averages of a security’s price. A continuation trend using MACD typically involves observing the MACD line crossing above the signal line, indicating a potential bullish continuation, or crossing below for a bearish continuation.
In other hands, MACD can also be use to identify potential bottom or top before going reversal.
OPEN ISLAMIC ACCOUNT >> CLICK HERE
Dapatkan update lebih cepat dan pantas melalui telegram kami.
Continuation trend signal
For a bullish continuation:
- Look for the MACD line crossing above the signal line.
- Confirm with the MACD histogram moving into positive territory.
For a bearish continuation:
- Look for the MACD line crossing below the signal line.
- Confirm with the MACD histogram moving into negative territory.
For a Reversal trend signal
MACD (Moving Average Convergence Divergence) can be used to identify potential reversals in a trend. One of the common signals for a trend reversal using MACD is based on divergences between the MACD line and the price chart. Here’s how you can use MACD for reversal signals:
- Bullish Reversal Signal (Potential Bottom):
- Look for a scenario where the price is making new lows, but the MACD histogram is not confirming those lows. This is known as bullish divergence.
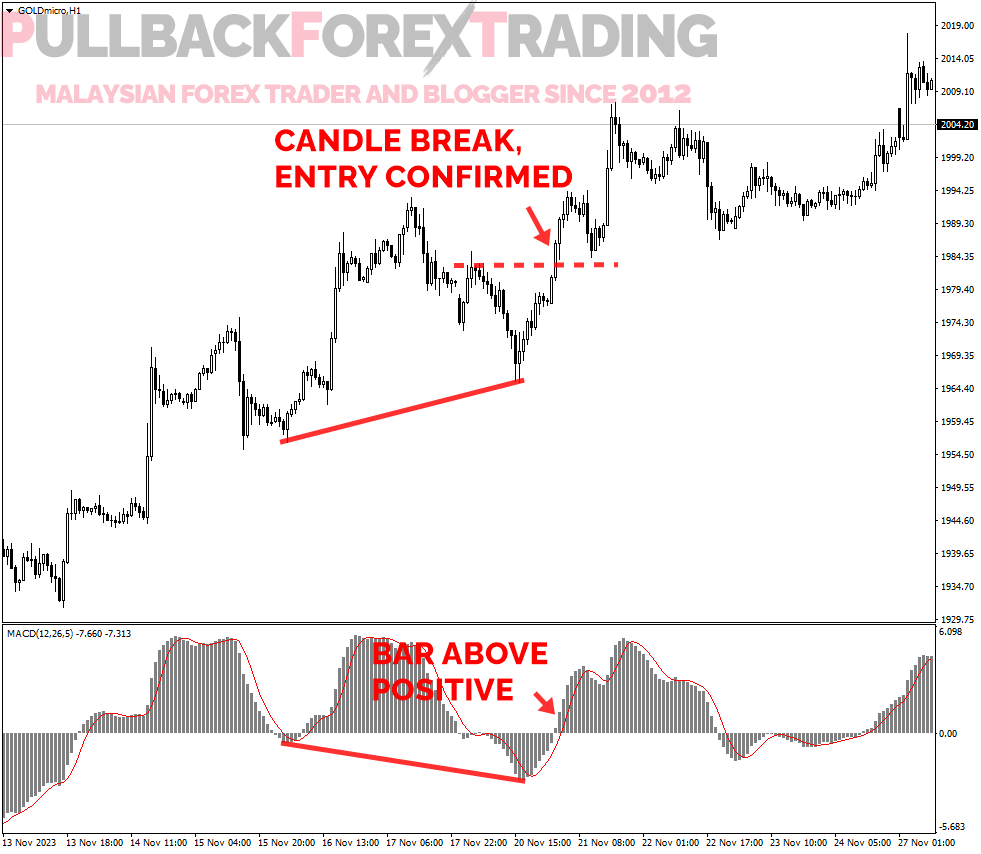
- Specifically, if the price is making lower lows, but the MACD histogram is making higher lows or is at least not confirming the lower lows, it may suggest weakening bearish momentum and a potential reversal to the upside.
- Bearish Reversal Signal (Potential Top):
- Look for a scenario where the price is making new highs, but the MACD histogram is not confirming those highs. This is known as bearish divergence.
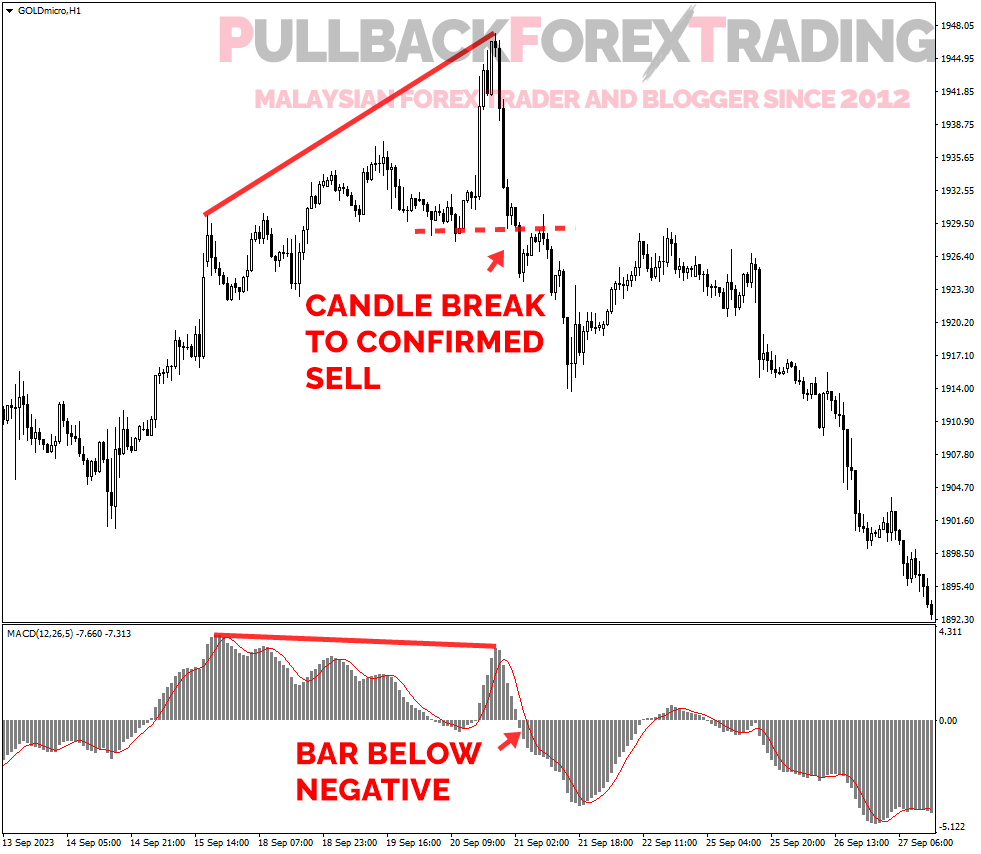
- If the price is making higher highs, but the MACD histogram is making lower highs or is not confirming the higher highs, it may suggest weakening bullish momentum and a potential reversal to the downside.
Additionally, traders often look for the following signals:
- MACD Line Crosses Signal Line:
- A bullish reversal signal occurs when the MACD line crosses above the signal line, suggesting a potential shift to an uptrend.
- A bearish reversal signal occurs when the MACD line crosses below the signal line, indicating a potential shift to a downtrend.
- Zero Line Crossover:
- A bullish reversal signal can occur when the MACD histogram crosses above the zero line, indicating a potential shift from bearish to bullish momentum.
- A bearish reversal signal occurs when the MACD histogram crosses below the zero line, suggesting a potential shift from bullish to bearish momentum.
MACD Custom Setting
Traders often create custom MACD settings based on their specific trading styles, preferences, and the characteristics of the assets they are trading. Here are several reasons why traders customize MACD settings:
- Adaptation to Market Conditions:
- Different financial instruments and market conditions may require different settings to provide accurate and timely signals. Traders adjust MACD settings to align with the characteristics of the specific asset they are trading.
- Short-Term vs. Long-Term Trading:
- Traders with different time horizons may customize MACD settings accordingly. Short-term traders might prefer faster settings (lower periods), while long-term investors may use slower settings to capture broader trends.
- Volatility Considerations:
- Some traders adjust MACD settings to make the indicator more or less sensitive to volatility. In volatile markets, a trader might use shorter settings to capture rapid price changes, while in stable markets, longer settings might be employed.
- Divergence Emphasis:
- Traders interested in identifying divergences between price and MACD signals may customize settings to emphasize divergence signals. This can be particularly useful for those looking for potential trend reversals.
- Personal Trading Style:
- Traders have different styles and preferences. Some may prefer more signals with shorter settings for active trading, while others might opt for fewer but more reliable signals with longer settings.
- Strategy Optimization:
- Traders often backtest different settings to optimize their trading strategy based on historical data. Customizing MACD settings can help identify settings that align with a specific strategy’s goals.
- Experimentation and Improvement:
- The financial markets are dynamic, and traders are continually looking for ways to improve their strategies. Experimenting with custom settings allows traders to refine their approach and adapt to changing market conditions.
- Combination with Other Indicators:
- Traders frequently use MACD in conjunction with other technical indicators. Customizing MACD settings allows them to harmonize its signals with other indicators for a more comprehensive analysis.
In summary, traders create custom MACD settings to fine-tune the indicator to their specific needs and improve its effectiveness within their trading strategy. It’s important for traders to test and analyze different settings to find what works best for their individual goals and market conditions.
5 MACD settings
Customizing MACD settings can help traders tailor the indicator to their specific preferences or market conditions. Here are five idea of custom settings for MACD:
- Standard Settings:
- Fast EMA: 12
- Slow EMA: 26
- Signal Line: 9
- Shorter-Term Trend Analysis:
- Fast EMA: 8
- Slow EMA: 17
- Signal Line: 9
- Longer-Term Trend Analysis:
- Fast EMA: 21
- Slow EMA: 55
- Signal Line: 9
- Volatility Adjustment:
- Fast EMA: 5
- Slow EMA: 13
- Signal Line: 8
- Divergence Emphasis:
- Fast EMA: 12
- Slow EMA: 26
- Signal Line: 5
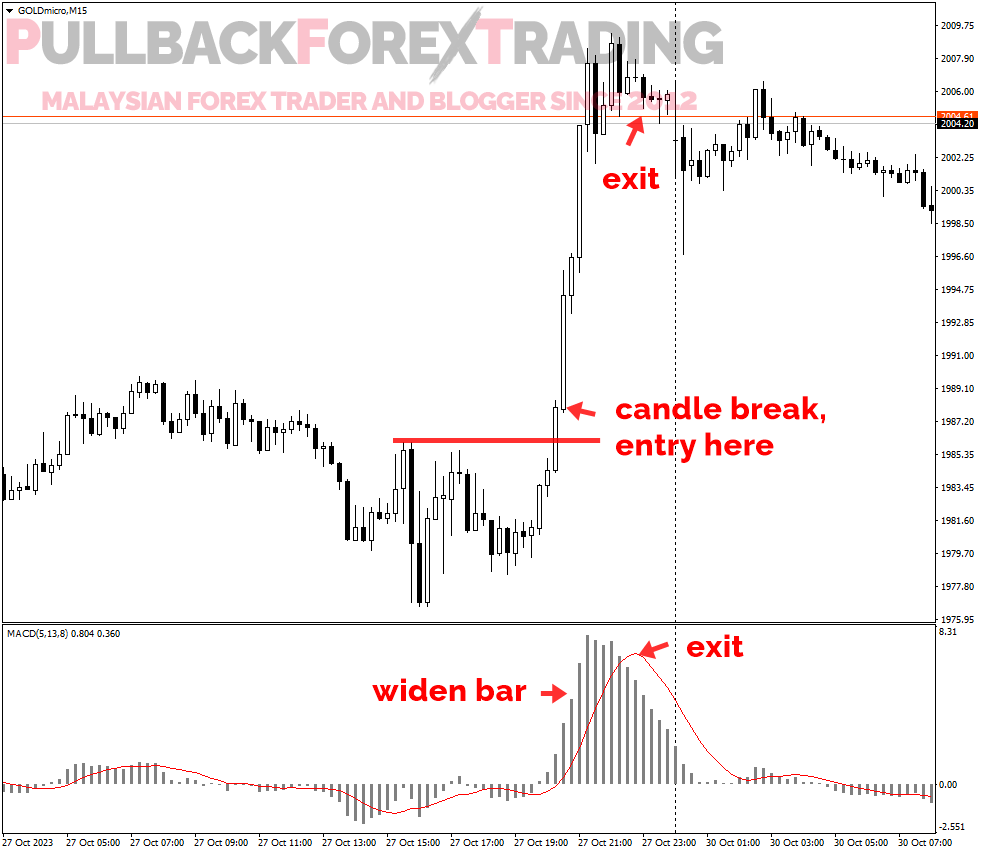
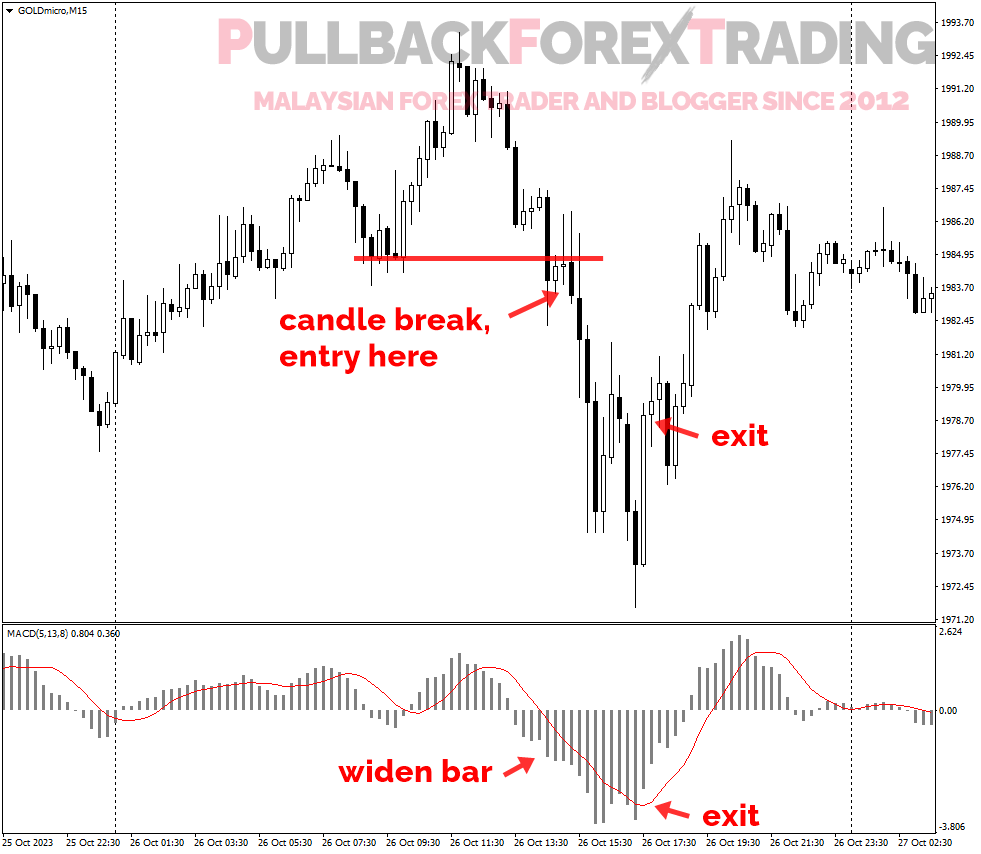
Identify trend volatility using MACD 5,13,8
To identify trend volatility using MACD with custom settings (5, 13, 8), you can follow these guidelines:
- Histogram Analysis:
- Pay attention to the MACD histogram. A widening histogram indicates increasing volatility, suggesting a potentially stronger trend.
- Positive histogram values imply bullish momentum, while negative values indicate bearish momentum.
- Signal Line Crossings:
- Watch for crossovers between the MACD line (5, 13) and the signal line (8).
- Bullish crosses (MACD line crossing above the signal line) during periods of increasing histogram bars can signal rising volatility in an uptrend.
- Bearish crosses (MACD line crossing below the signal line) with increasing negative histogram bars may suggest rising volatility in a downtrend.
- Divergence:
- Look for divergence/convergence between price and the MACD histogram. Divergence can indicate a potential change in volatility.
- Bullish divergence occurs when prices make new lows, but the MACD histogram does not. This might signal decreasing volatility in a downtrend.
- Bearish divergence happens when prices make new highs, but the MACD histogram does not. It could indicate decreasing volatility in an uptrend.
This great strategy can be apply to trade Gold(XAUUSD) or GBPJPY pair.


I’m using XM MT4 platform. Get yours here.
Divergence Emphasis 12,26,5
In the context of MACD settings with a “Divergence Emphasis” (Fast EMA: 12, Slow EMA: 26, Signal Line: 5), the emphasis is placed on identifying divergences between the price movement and the MACD indicator. Here’s a breakdown of each component:
- Fast EMA (Exponential Moving Average):
- This is a 12-period exponential moving average of the price. It gives more weight to recent prices, making it responsive to short-term price changes.
- Slow EMA (Exponential Moving Average):
- This is a 26-period exponential moving average of the price. It provides a smoothed representation of the longer-term price trend.
- Signal Line:
- The Signal Line is a 5-period exponential moving average of the MACD line. It is used to generate trading signals. When the MACD line crosses above the Signal Line, it may indicate a bullish trend, and when it crosses below, it may indicate a bearish trend.
With these settings, the MACD is more sensitive to short-term price movements (Fast EMA: 12) and gives less weight to longer-term trends (Slow EMA: 26). The shorter Signal Line (5) makes the MACD more responsive to recent changes in trend direction.
Divergence Emphasis Explanation:
- Bullish Divergence:
- Occurs when the price makes new lows, but the MACD histogram does not confirm with new lows, possibly indicating weakening bearish momentum and potential for a bullish reversal.
- Bearish Divergence:
- Happens when the price makes new highs, but the MACD histogram does not confirm with new highs, suggesting weakening bullish momentum and potential for a bearish reversal.

Continuation Trend Explanation:
For continuation trend, we just need to look difference divergence between trend and MACD histogram.
- For uptrend:
- Higher-high occurs on price trend but MACD histogram display lower-low.
- For Downtrend:
- Lower-low occurs on price trend but MACD histogram display higher-high.

The emphasis on divergence in these settings can be useful for traders looking to identify potential trend reversals based on discrepancies between price and MACD movements. However, as with any trading strategy, it’s crucial to use divergence signals in conjunction with other technical indicators and analysis for confirmation.
Timeframes
The most suitable timeframe for MACD analysis depends on your trading strategy, goals, and the level of detail you’re looking for. Here are some considerations:
- Short-Term Trading (Intraday):
- For day traders or those focusing on short-term movements, lower timeframes like 5-minute or 15-minute charts may be suitable. The MACD settings with a shorter lookback period (e.g., Fast EMA: 5, Slow EMA: 13, Signal Line: 8) can provide more responsive signals in fast-paced markets.
- Medium-Term Trading (Swing Trading):
- If you’re a swing trader, using 1-hour or 4-hour charts may be appropriate. The MACD settings with standard values (Fast EMA: 12, Slow EMA: 26, Signal Line: 9) or slightly adjusted settings can help capture medium-term trends.
- Long-Term Trading (Position Trading):
- For longer-term investors or position traders, daily or weekly charts might be more suitable. Using MACD settings with longer lookback periods (e.g., Fast EMA: 21, Slow EMA: 55, Signal Line: 9) can help identify and confirm broader trends.
Best time to find entry
This strategy works well on US market open.
Conclusion
Remember, the choice of timeframe is a crucial aspect of your trading strategy. Shorter timeframes can provide more frequent but potentially more volatile signals, while longer timeframes may offer more stable trends but with fewer signals. It’s essential to align your timeframe with your trading objectives and risk tolerance.
Additionally, consider combining MACD analysis with other indicators and tools to strengthen your overall trading approach and confirm signals across multiple dimensions.


