Mastering Fibonacci Retracement Trading for Beginners: A Step-by-Step Guide
Embarking on your forex trading journey as a beginner can be both exciting and overwhelming. One powerful tool that can help demystify market movements and guide your trading decisions is the Fibonacci retracement. In this comprehensive guide, we’ll unravel the secrets of Fibonacci retracement trading, providing you with a solid foundation to navigate the markets with confidence.
What is Fibonacci?
The story of Fibonacci traces back to 13th-century Italy, where a mathematician named Leonardo of Pisa, also known as Fibonacci, introduced a sequence of numbers that would later revolutionize trading. The Fibonacci sequence, starting with 0 and 1, generates each subsequent number by adding the two preceding ones (0, 1, 1, 2, 3, 5, 8, 13, and so on). This sequence holds a unique mathematical ratio, the golden ratio of 1.618, which manifests across various aspects of nature and art.

Fast forward to modern trading, where the Fibonacci sequence finds its application in Fibonacci retracement. Traders use this tool to identify potential support and resistance levels in price charts. The allure lies in its ability to decipher market movements, helping traders predict where trends might stall or reverse. By understanding this historical mathematical blueprint, traders gain a valuable edge in navigating the complexities of financial markets and making more informed trading decisions.
Fibonacci Retracement: Unveiling the Golden Ratio in Trading
The Fibonacci retracement levels – 23.6%, 38.2%, 50%, 61.8%, and 78.6% – are like secret support and resistance levels hidden in plain sight on your price chart. These levels indicate potential reversal zones within a broader trend. For example, after a price trend is established, a retracement (temporary reversal) often occurs. This is where the Fibonacci retracement levels come into play.
Imagine this: you’ve just entered the world of forex trading, and you’re eager to identify high-probability entry points. Let’s say a currency pair has been on a bullish run, but you’re hesitant to jump in at the current price. This is where the Fibonacci retracement tool shines. You draw the tool from the swing low to the swing high of the recent uptrend.
The tool automatically plots the retracement levels on your chart. Now, you have potential support zones where the price might find a temporary floor before resuming its upward journey.
Here is an example, 61.8 acts as a support level for buying opportunity. This Fibonacci retracement level is specific and makes trading more easy.
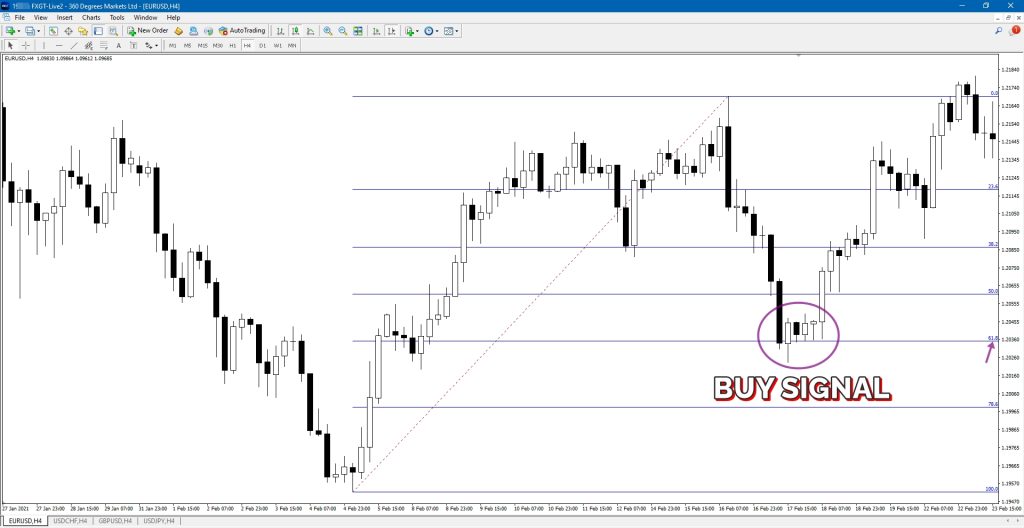
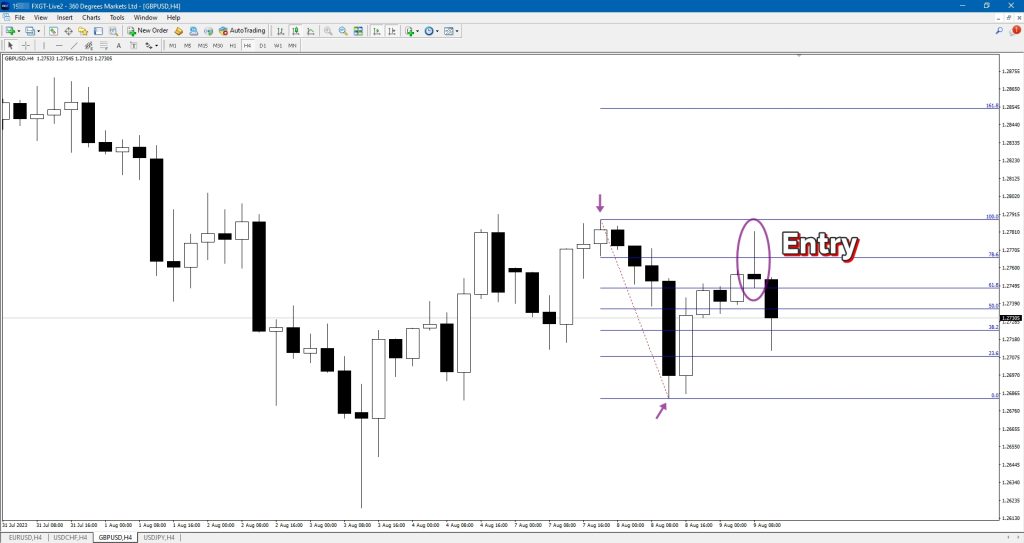
Sell example;
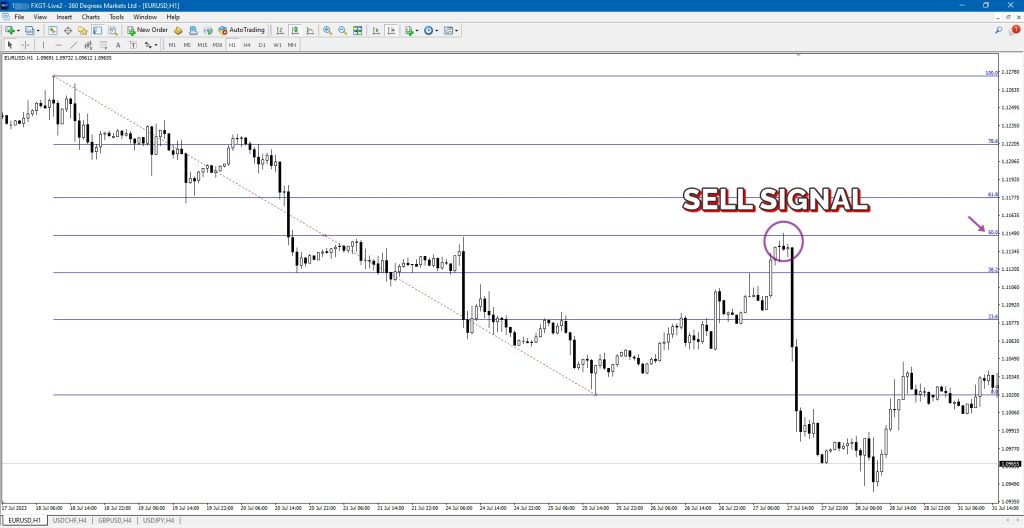
With Fibonacci retracement tools, traders easily identify potential entry points from support or resistance based on Fibonacci levels. From the picture above we can see Fibonacci level of 50.0 as a resistance level for selling entry.
1). Access the Fibonacci Retracement Tool: navigate to the tool menu and select the Fibonacci retracement tool. It’s just a click away, ready for you to apply to your chosen currency pair.

2). Identify Swing Points: Begin by pinpointing the significant swing points that define the trend you wish to analyze. First, click on the swing low (the starting point of the trend), and then on the swing high (the end point of the trend).
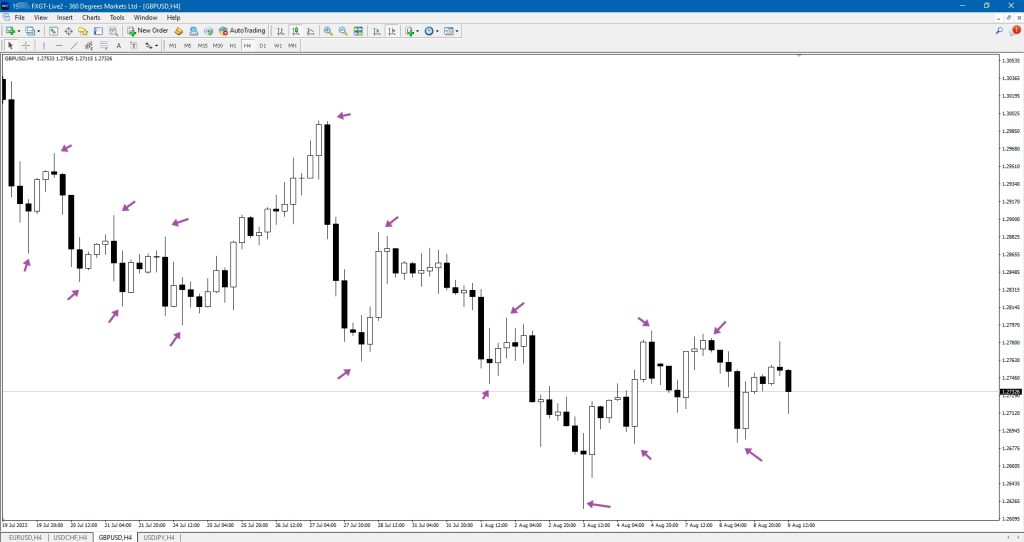
3). Manual Placement: You’ll manually draw lines connecting the swing points to the desired Fibonacci retracement levels. This manual approach ensures precision and customization.
To draw Fibonacci retracement, you may connect the low to high for uptrend and high to low for downtrend.
Low and High will be known as “Swing point.”
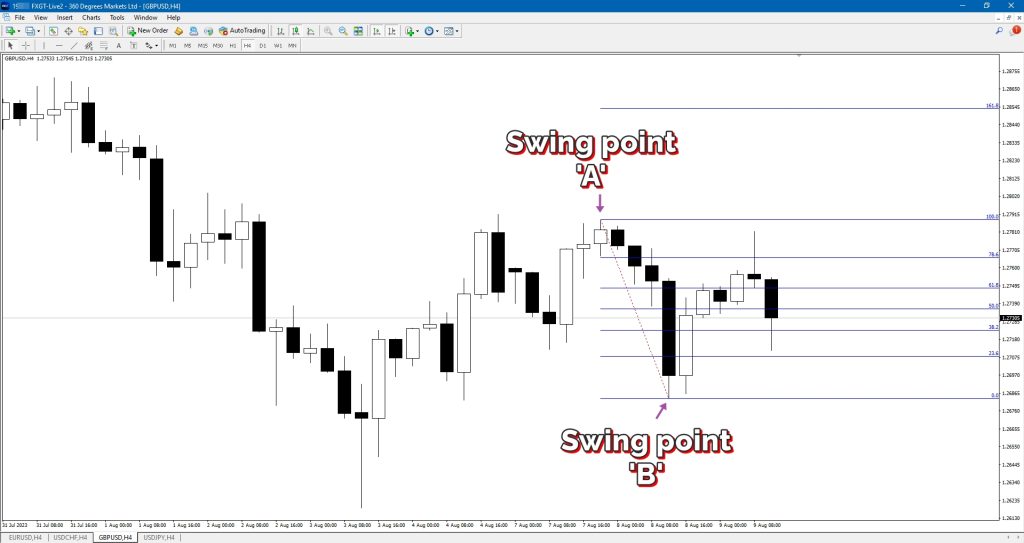
4). Strategically Plan Your Trades: As you draw the retracement levels, observe how they align with price movements. These retracement levels serve as potential support or resistance zones, indicating where price might retrace before resuming its original trend. For instance, if the price retraces to the 38.2% level that you’ve manually marked, it could signal an opportunity to enter a trade, anticipating a potential bounce-back.
The Power of Confluence: Combining Fibonacci with Other Tools
While Fibonacci retracement is a potent tool in isolation, its effectiveness amplifies when harmonized with other technical indicators and tools.
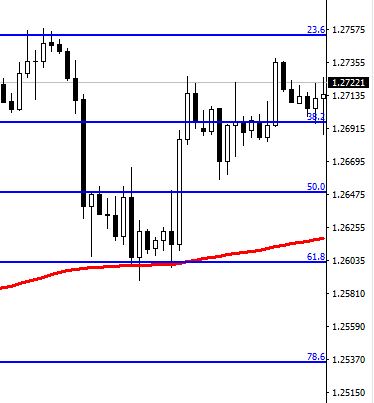
For instance, envision that you’re analyzing a potential trade using Fibonacci retracement, and you notice that the 61.8% retracement level aligns with a significant moving average on your chart. This convergence of signals is known as confluence – a powerful indicator of a potential trade setup.
Profitable Combination
Combining the precision of Fibonacci retracement with other strategic tools creates a symphony of insights, guiding your trading decisions with enhanced accuracy. Here are three compelling examples of confluence that can amplify your trading:
Fibonacci and Moving Averages
Blend the elegance of Fibonacci retracement with the practicality of moving averages. Imagine the 50% or 61.8% Fibonacci retracement level aligning harmoniously with a 200-period moving average on your chart. This convergence signals a potential sweet spot – where historical price equilibrium meets trend analysis. The result? A robust confluence that strengthens your decision-making, confirming potential entry or exit points.
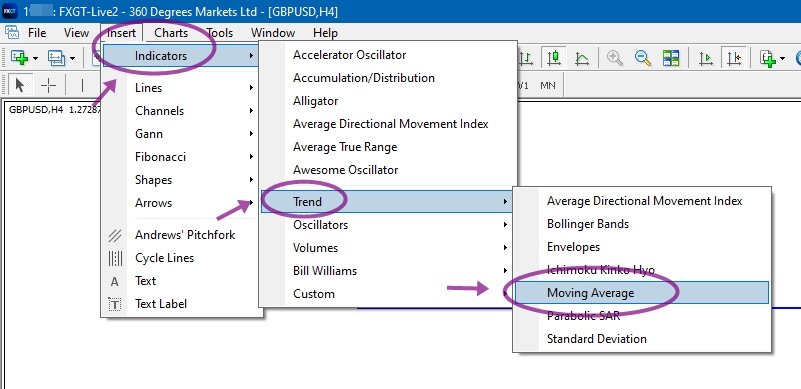
Inserting indicator
At the MT4 platform, go to INSERT > INDICATORS > TREND > MOVING AVERAGE
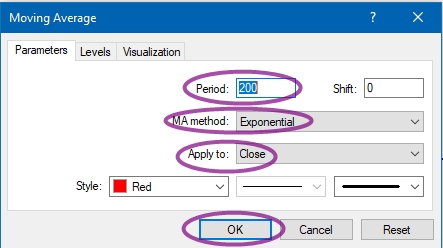
Setting:
Set the period to 200, MA method to Exponential, Apply to Close. Choose any color you like then hit OK to complete.
Example of trade setup as follow;
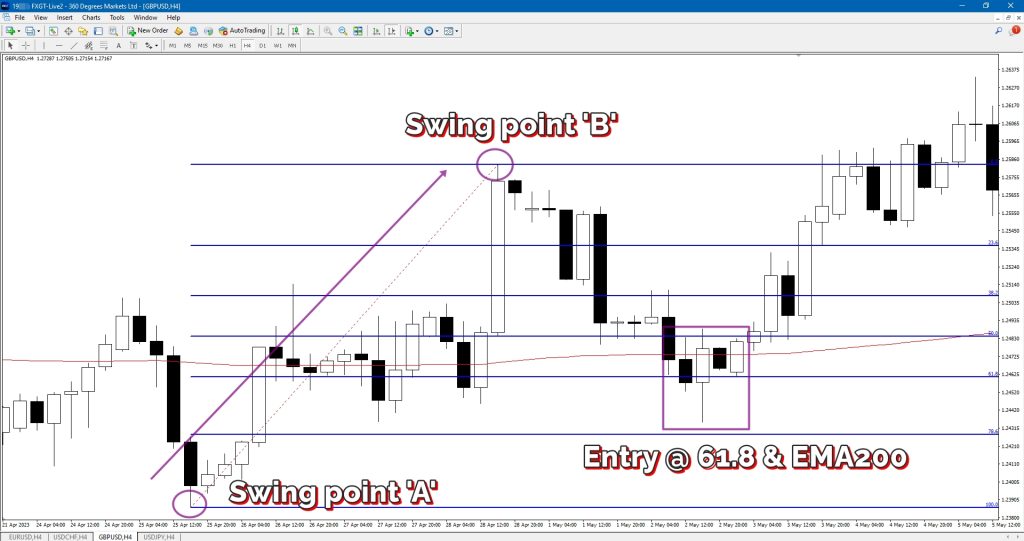
Confluence Example #1:
In a hypothetical trade scenario:
- A currency pair has been trending upward, and you’re considering a long (buy) position.
- The price retraces to the 61.8% Fibonacci level, indicating a potential support zone.
- Interestingly, the EMA200 aligns perfectly with the Fibonacci retracement level.
This confluence of the EMA200 and the 61.8% Fibonacci retracement forms a compelling support zone. The EMA200 adds a layer of dynamic support based on historical price action, while the Fibonacci level reinforces this support with its mathematical significance. As a trader, you have two distinct but harmonizing factors indicating a potential bounce and continuation of the upward trend.
In this scenario, the EMA200 provides a more immediate and adaptive form of support, while the Fibonacci level adds an additional layer of historical context. The combination enhances the credibility of the support zone, giving you greater confidence in your trading decisions.
By incorporating the EMA200 and Fibonacci retracement levels as Support and Resistance (SNR) in your analysis, you capitalize on the power of confluence. This intersection of different tools creates a holistic perspective that strengthens your trading strategy, guiding you towards well-informed decisions and potentially more successful trade setups.
Another example.
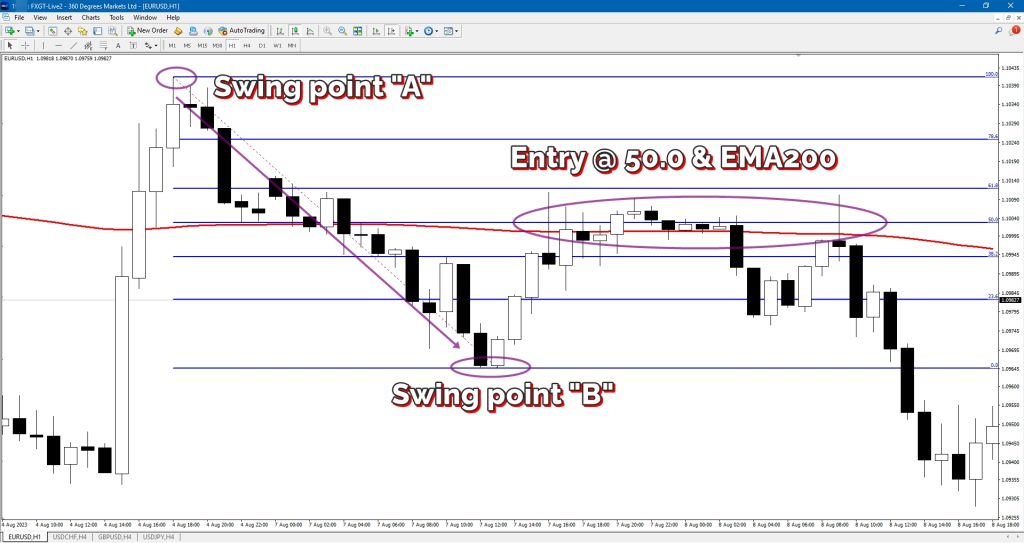
Confluence Example #2:
In a hypothetical sell setup:
- A currency pair has been in a downward trend, and you’re contemplating a short (sell) position.
- The price retraces to the 50.0% Fibonacci level, signifying a potential resistance zone.
- Interestingly, the EMA200 coincides precisely with the Fibonacci retracement level.
This confluence of the EMA200 and the 50.0% Fibonacci retracement creates a compelling resistance zone. The EMA200 contributes dynamic resistance based on historical price action, while the Fibonacci level reinforces this resistance with its mathematical significance. As a trader, you encounter a dual-layered indication of a potential price reversal and continuation of the downtrend.
In this scenario, the EMA200 imparts an adaptable form of resistance, while the Fibonacci level enhances it with historical context. This fusion augments the validity of the resistance zone, bolstering your confidence in the trade decision.
By integrating the EMA200 and Fibonacci retracement levels as Support and Resistance (SNR) within your analysis, you harness the potency of confluence. The intersection of distinct tools generates a comprehensive perspective that fortifies your trading strategy, guiding you toward astute decisions and potentially more lucrative sell setups. Remember, mastering the art of trading involves understanding how these tools harmonize to unveil the market’s intentions.
Fibonacci and RSI (Relative Strength Index)
Unveil the hidden dynamics of price movement by uniting Fibonacci retracement with RSI, a momentum oscillator. Fibonacci retracement coinciding with an RSI reading below 30 or above 70 – a classic sign of oversold or overbought conditions. This convergence signals a potential reversal point where price may bounce back. The fusion of Fibonacci’s predictive abilities, with RSI’s momentum insights offers a formidable edge.
Insert indicator
On the MT4 platform, go to INSERT > INDICATORS > OSCILLATORS > RELATIVE STRENGTH INDEX
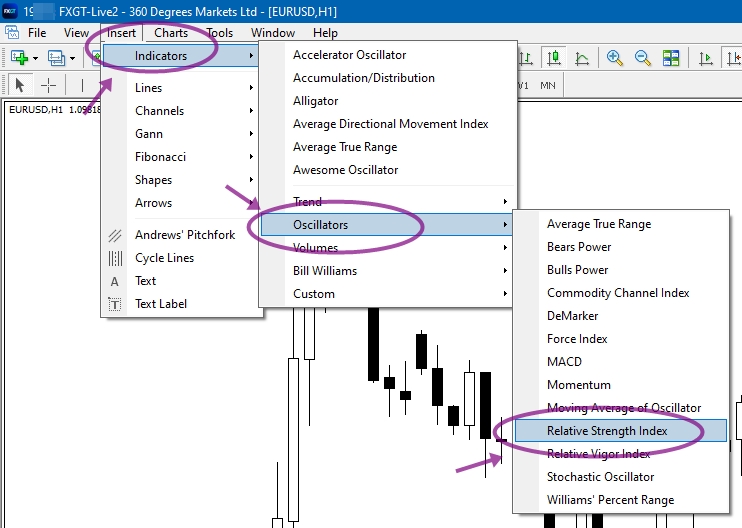
No change on the setting. Just keep it default setting.
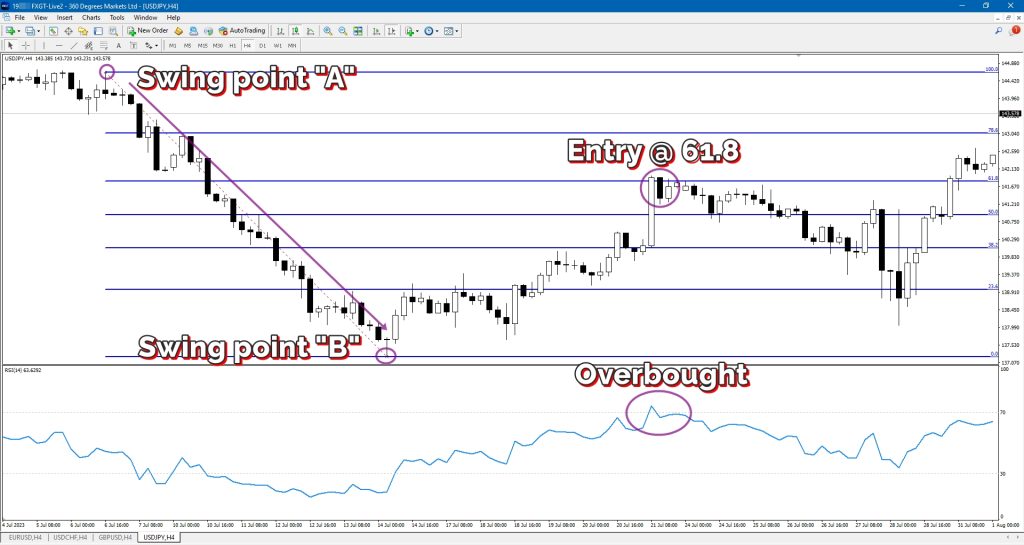
Example Sell Trade with Fibonacci 61.8% and RSI Overbought
Let’s walk through a practical trading scenario that combines the Fibonacci retracement level of 61.8% with an overbought condition in the Relative Strength Index (RSI). This confluence signals a potential sell trade opportunity:
Market Context
Imagine we’re observing a currency pair that has been in an uptrend for some time while the major trend on higher timeframe is a downtrend. Recent price action suggests that the trend might be losing steam and will reverse.
Step 1: Fibonacci Retracement Analysis
- Identify the Trend: Observe the currency pair’s recent overall trend is in a downtrend, at a higher timeframe and has been uptrend in lower timeframe. Then pinpoint the swing high and swing low with Fibonacci retracement. Apply the Fibonacci retracement tool to draw the levels from the swing high to the swing low.
- Spot the Fibonacci Level: Notice that the 61.8% Fibonacci retracement level aligns with a potential resistance area. This level indicates a zone where price might reverse, offering a possible entry point for a sell trade.
Step 2: RSI Overbought Condition
- Assess the RSI: Examine the Relative Strength Index (RSI) indicator on the chart. The RSI measures the magnitude of recent price changes to evaluate overbought (above 70) or oversold (below 30) conditions.
- Confirm Overbought RSI: Observe that the RSI is currently above the overbought threshold of 70. This suggests that the currency pair’s price has potentially risen too far, too fast, and a reversal or retracement could be imminent.
Step 3: Confluence and Trade Decision
- Combine the Signals: The confluence of the 61.8% Fibonacci retracement level and the overbought RSI enhances the credibility of a potential price reversal. The combination of these two signals suggests that the currency pair’s upward momentum could be slowing down, making it an opportune moment for a sell trade.
- Entry and Stop-loss: Set an entry point just below the 61.8% Fibonacci level, anticipating a price reversal. Place a stop-loss slightly above the recent swing high to protect against a potential breakout.
- Take-profit: Identify a take-profit level based on your risk-reward ratio and technical analysis. This could be set at a previous support level or a Fibonacci extension level. The simpler way to exit is based on Fibonacci retracement zone.
Conclusion
Combine the structural insight of Fibonacci retracement with the guiding force of trendlines. Visualize the Fibonacci level intersecting precisely with a well-established trendline. This harmony suggests a strategic opportunity – a potential trend confirmation zone. By layering Fibonacci’s predictive levels with trendlines’ directional guidance, you create a confluence that enhances your trade execution confidence.
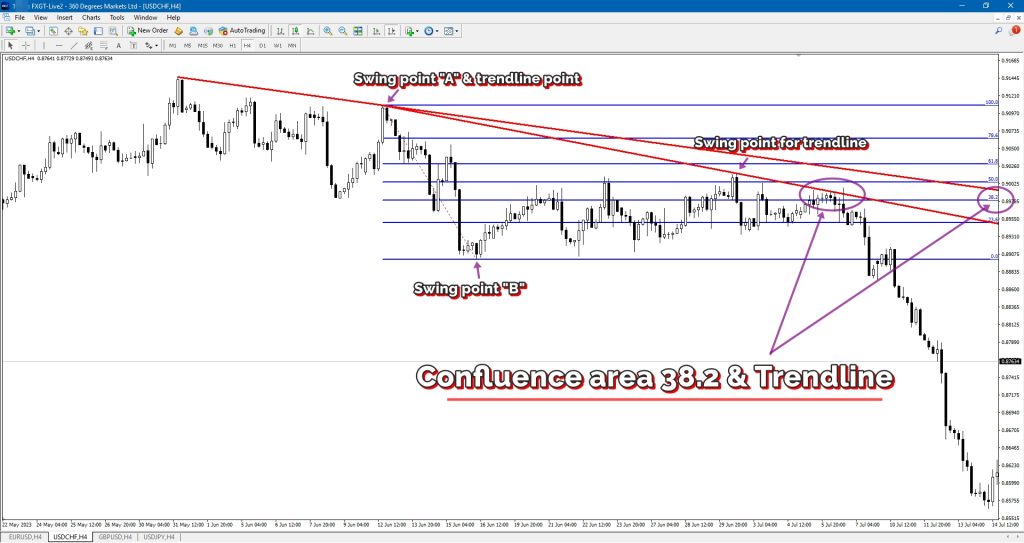
Sell Signal with Confluence: Fibonacci 38.2% and Trendline Intersection
Let’s explore a compelling trading scenario that combines the confluence of the Fibonacci retracement level of 38.2% with the intersection of a trendline. This synergy creates a potential sell signal, offering traders an opportunity to capitalize on a potential price reversal:
Market Contexts
Imagine we’re observing a currency pair that is in a downtrend movement. Recent price action indicates that it retraced a little bit but is still in a downtrend. Now we are looking for a selling opportunity at the time price is making its high.
Step 1: Fibonacci Retracement Analysis
- Identify the Trend: Analyze the currency pair’s chart and identify the trend and retracement. Determine the swing high and swing low points that define this trend.
- Pinpoint the 38.2% Level: Observe that the 38.2% Fibonacci retracement level aligns closely with the trendline. This confluence highlights a critical zone where price may encounter resistance and initiate a reversal.
Step 2: Trendline Intersection
- Draw the Trendline: Plot a trendline connecting the series of higher lows in the uptrend. Observe how this trendline intersects with the 38.2% Fibonacci retracement level.
- Confirm the Confluence: The intersection of the trendline and the Fibonacci level enhances the significance of this price zone. It indicates that both technical elements are converging at the same point, potentially reinforcing a reversal.
Step 3: Confluence and Trade Decision
- Combine the Signals: The confluence of the 38.2% Fibonacci retracement level with the trendline intersection strengthens the case for a potential price reversal. This dual confirmation suggests that the currency pair’s short term upward momentum could be tapering off, providing a favorable context for a sell trade.
- Entry and Stop-loss: Consider initiating a sell position just below the 38.2% Fibonacci level, anticipating a reversal. Place a stop-loss above the recent swing high or above the trendline to mitigate risk in case of a breakout.
- Take-profit: Identify a suitable take-profit level based on your risk-reward ratio and technical analysis. Potential targets could include previous support levels or Fibonacci extension levels such as 161.8% or 261.8% levels.
Conclusion
By strategically aligning the 38.2% Fibonacci retracement level with the intersection of a trendline, you’ve pinpointed a potential sell signal. This confluence of technical elements signifies a convergence of factors suggesting an impending price reversal will happen soon. Remember, while confluence enhances the probability of a successful trade, prudent risk management and continuous market monitoring remain essential for trading success.
Conclusion:
As a beginner, mastering Fibonacci retracement trading unveils a world of informed trading decisions.
Whether you’re dissecting trends, strategizing trades, or seeking confluence, the interplay between Fibonacci retracement can guide you toward potentially lucrative opportunities. Embrace this dynamic synergy and embark on your trading journey with newfound knowledge and unwavering confidence.
ADMIN
10/08/23
ARTIKEL INI DITAJA OLEH FXGT.

