Chaos trading system
his chaos trading system is a very simple and easy to follow if we implements all the five dimensions described by Bill Williams in his “New Trading Dimensions”.
How to Profit from Chaos in Stocks, Bonds and Commodities and even Forex” and this 5 dimension have to used in this chaos trading style by bill williams including:
• Fractal dimension;
• AO (Awesome Oscillator) dimension;
• AC (Accelerator/Decelerator Oscillator) dimension;
• Zone dimension;
• Base Line dimension (Alligator teeth – red base line).

I recently found out chaos system and read the books about it (by Bill Williams). I was convinced by the reading I tried the system for a while…
I seems worth able for me and I’ve hope this trading system will help us to get more pips and here it is:
On the chart apply following tools
Alligator – Three SMAs (13/8/5) with a future offset of 8/5/3 respactively.
Fractals – 5 bars sequence where middle one has highest High / lowest Low and its preceded and followed two bars have lower highs / higher lows
preceded by two lower highs and is followed by two lower highs
Awesome Oscillator (AO) – difference between the 34-period and 5-period simple moving averages of the bar’s midpoints (H+L)/2
Acceleration Oscillator (AC) – difference between 5/34 momentum histogram (AO) and a 5-bar simple moving average on the AO.
To apply then add this following indicators into MetaTrader 4 platform use these menus
Alligator: Insert -> Indicators -> Bill Williams –> Alligator
Fractals: Insert -> Indicators -> Bill Williams –> Fractals
Awesome Oscillator: Insert -> Indicators -> Bill Williams –> Awesome Oscillator
Acceleration Oscillator: Insert -> Indicators -> Bill Williams –> Acceleration Oscillator
Enter :
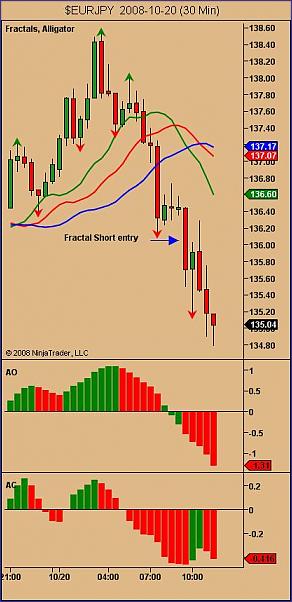
The fractal for buying – a series of five consecutive bars in which two bars with lower maximums stand before the highest maximum and two – after it.
The fractal for selling – a series of five consecutive bars in which two bars with the higher minimums stand before the lowest minimum and two – after it.
The fractals for buying and selling may consist of the same bars.
The fractals set the following signals:
- if a fractal for buying is above the Alligator’s teeth (red line) then the pending order Buy Stop for opening the position should be placed one pips higher than the maixmum of the bar the fractal was formed at;
- if a fractal for selling is below the Alligator’s teeth then the pending order Sell Stop should be placed one pips lower than the minimum of the bar the fractal was formed at.
The fractals will be active either till the moment of their “defeat” or till the new fractal in the same direction appears (in this case the previous signal is cancelled and the pending order is taken away).
It is critically important where the fractal was “defeated”, i.e. which bar to enter the market at after the passage of fractal. If the bar is beyond the Alligator’s teeth then such trade is allowed.
Exit:
The method of exiting the market that is sensitive to the price dynamics allows to fix the profit within the last 10 % of the trend taking about 80% of the movement (according to B. Williams).
Bill Williams proposed several methods of placing the Stop Loss orders:
- If a trend exists at the market then you should close the positions if the bar crosses with its close price the Alligator’s teeth (the red line).
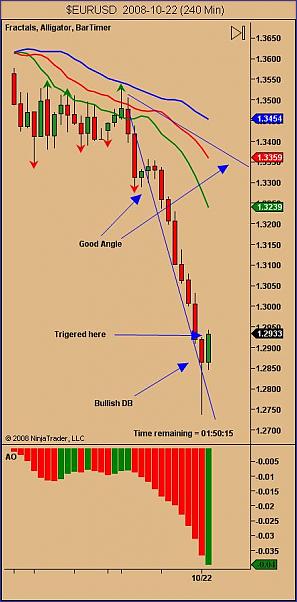
- We use the Alligator’s jaws (the green line) as a level for the Stop Loss order on an impetuous market. The market is considered to be impetuous if the inclination angle of the price is greater than the inclination angle of the green line. By this and the previous methods the Stop Loss order is moved to the level of the red or the green line of the next bar at the end of the current bar.
- We place the Stop Loss order after the appearance of the fifth consecutive bar in the green (red) zone (this method was considered above in the description of the zone trading).
- If a signal in the opposite direction appears then we close the opened position.

Adding Entry Signals:
AO:
We go long when AO cross zero line from negative to positive values and short on the opposite scenario.
We go long we have 3 consecutive AO bars above zero line last two having higher highs (i.e. AO pulls back for a while)
– opposite for sell
AC:
Go long after two consecutive bars above zero line
Go long after three consecutive bars below zero line –
for short – reverse scenario
Signals coming directly from the price chart and Alligator indicator according to the description in the book “New Trading Dimensions”.
We trade in the direction of the developing trend. We do not trade if there is no trend.
We define the availability or lack of the trend according to the lines of the Alligator indicator. If the lines are intertwined, there is no trend in the market. If the Alligator lines are separated and oriented in the same direction, this means the market is in the condition of the trend in the trend wave of one or another level. It is necessary to trade according to the indicator’s open lines. The point of entering the bullish trend market is the fractal break above the teeth line of the Alligator indicator (red line), and the bearish trend – in the fractal break below the above mentioned line. In such a way the trader never stays aside of the trend which is being generated.
If following the rise or fall period with the open Alligator’s lines the price of the period has closed in the indicator’s mouth, this means that after the period of trend movement the market enters the stage of correction, consolidation or maybe even turning. The signals from the “Balance Line” may be seen from the chart. They include:
– buy signal above the balance line
– sell signal below the balance line
– buy signal below the balance line
– sell signal above the balance line
Let me remind you that the balance line for the day range is a blue line of the Alligator indicator – jaw line.
Signals from the ?? (Awesome Oscillator) indicator:
– the signal of the generation of the price divergence and the “Twin Peaks” oscillator indicators. Even if there is no divergence in the market, this signal tells the trader that the trend movement in the market is weakening.
– The signal showing that the histogram of the ?? indicator crosses the zero line.
– The signal showing the change of the color of the histogram into the opposite color that indicates respective trend set by the Alligator indicator. The signal is called “Saucer”.
Signals from the ?? (Awesome Oscillator) indicator:
There are three types of signals from this indicator. The first two types of the signals come from the histogram when the histogram of the AC indicator is below or above the zero line. If two consecutive bars of the histogram are formed above the zero line, the break of the highest high of the corresponding bar position with the second such column of the AC histogram will be considered a buy signal. A sell signal – similarly, but with the AC histogram in this case below the zero line. The third type of the signal is the colour of the histogram of the AC indicator. If it is green, it means that the prices in the market tend to increase, if it is red – to decrease. The change of the colour of the histogram by the AC indicator is an initial signal to the trader that the histogram of the AO indicator will also change its colour soon.
Further accelerated development of computer technology at the beginning of the 21st century did not only allow applying the up-to-date methods of market analysis, but gave new possibilities of computer trading which substantially changed the market prices behaviour. The market became more volatile and variable. In their recent book “Trading Chaos second edition” Bill Williams and his daughter Justine Williams made material changes to the trading tactics and adjusted their interpretation of the indicators indices.
The new contemporary trading techniques based on the “Trading Chaos” strategy exclude the AC indicator and the signals coming from it from the analytical pattern. Only three indicators remain in the chart, namely: Alligator indicator with the original settings, Fractals indicator and AO indicator. Now it is called “Super AO”. The analysis starts from analyzing the last generated bars and their location against the Alligator indicator’s lines.
The book repeatedly includes the information about the understanding of the extreme, neutral and targeted bars. The fractal signals are described, as well as the understanding of the direction of the market with the help of the Alligator indicator, the notions of ‘divergence’ and ‘Squat-bar’ are explained on examples. The last book out of the trilogy substantially reduces the number of the trading signals:
– “First Wise man Signal”- formation of the bullish or bearish divergent bar (B/D/B).
– “Second Wise man Signal” is a signal for adding on the break point the maximum (minimum) price of the corresponding bar with the third bar of the histogram of the Super AO indicator.
– “Third Wise man Signal” is the entrance to the market at the break point of the fractal level.
The book clearly regulates the signals for placing the points of protecting the trading profit and points of entering and exiting the market. The trading strategy becomes more aggressive, flexible and complying with the contemporary markets. Trading according to this system is very profitable on the one hand, but extremely dangerous on the other.
The danger lies in non-readiness, wrong interpretation of the signals described in the Russian version of the book, lack of special software. The mission of this web site is to give the trader the opportunity to get trained in trading according to the “Trading Chaos” strategy with the help of using the author’s training video course Home Study Course of Bill and Justine Williams, to provide the special software for the efficient trading based on the above mentioned strategy.
Good luck in trading! TREND is with us! Happy Pips With Bill Williams Strategy ![]()

